The Kiel Fjord as an interactive 3D sea chart.
Demonstration and illustration only. Not a navigational aid and not an authoritative source of traffic or maritime domain information. Only official sources apply.
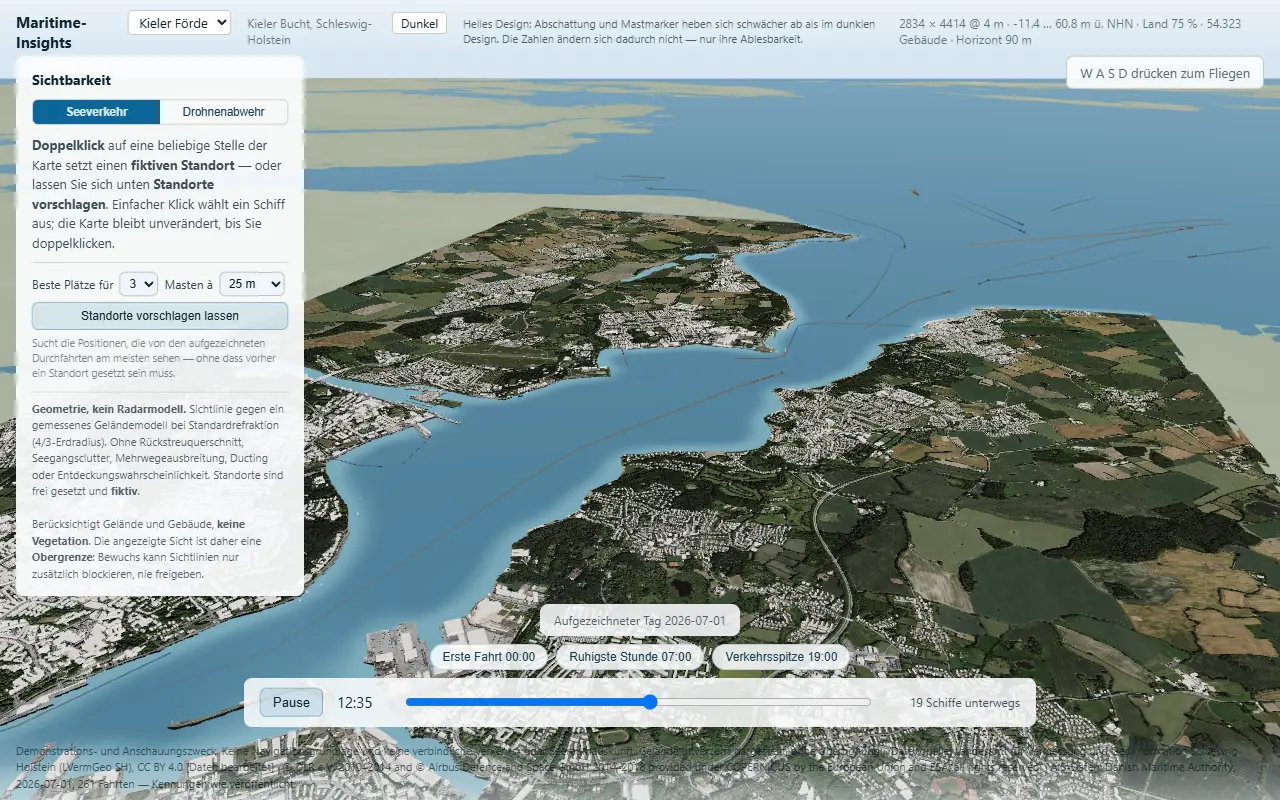

One notional 25 m mast on the west shore. 27.3 km² visible, 172.6 km² shadowed — and 82 % of the day's transits observed, 112 of 137. The percentage is the number a tender can be written around; the square kilometres are not.
What it does
A Microsoft Fabric App that renders 200 km² of the Kiel Fjord photoreal and at true scale from official 1 m survey data, replays real ship movements across it from open AIS, and lets you place a notional sensor site anywhere on the coast to see what that site can and cannot observe — because the terrain is real and it casts a real shadow.
The subject is coastal maritime domain awareness. The point is Fabric — Real-Time Intelligence, OneLake, Direct Lake, Notebooks and Pipelines, and above all the Fabric App itself as the delivery vehicle.
Three things you can do with it:
- Look at the fjord. DGM1 at 1 m, an orthophoto drape, LoD2 buildings, the harbour and the Holtenau locks — true scale, no vertical exaggeration.
- Replay the traffic. Real vessels on a scrubbable clock.
- Place a sensor and argue with it. Set a position and a mast height; the visible-surface shadow updates live.

The recorded day at its 19:00 peak, 53 vessels under way. 2834 × 4414 samples at 4 m, 54 323 buildings, and a Copernicus shell carrying the horizon out to 90 m posting — no vertical exaggeration anywhere, because the viewshed marches over these exact elevations.
The second area exists to make a point

The Schlei, 32 km up the same coast, reached from the switcher in the header — no reload, no second
build. The inlet is flatter than the fjord, yet sight lines are half as long: what stops a scan
here is the water's shape, not relief. Same code, same pipeline, different config/aoi/*.json.
What it computes, stated plainly: geometric visibility — a 4/3-earth radar horizon against a measured terrain model. It is not a radar model. No radar cross-section, no clutter, no propagation anomaly, no detection probability, no product performance data, in any build.
⚠️ "Live" traffic: what you will actually see
By default the app has one mode: the recorded day. There is no Live toggle unless you configure a relay, and that is deliberate.
The live path is real and still here — but the free public AIS source it was built against is sending nothing, so the relay stands in with the recording. That left two controls that both showed recorded traffic, which is a choice with no consequence: a puzzle in front of the reader rather than a feature. On the second AOI it was worse than useless, because the stand-in holds only the Kiel Fjord recording — switching to Live on the Schlei produced an empty sea (measured: 0 vessels in area against 61 reporting outside it).
- The traffic you see is a recorded day,
2026-07-01from the Danish Maritime Authority: 261 passages, 44 084 positions, on a scrubber with story beats. Real MMSIs and names. - To turn the live path back on, set
VITE_AIS_RELAYto a relay you run and rebuild. The toggle returns with it — no code change, nothing was deleted. - The upstream is down, not our key:
aisstream.iohas delivered zero frames to its entire user base since 2026-08-05. Our relay held an accepted subscription for 51 hours without one message (everReceived: false,messages: 0,upstreamErrors: 0, measured 2026-08-12). Their issue tracker carries a dozen identical reports and no maintainer reply.
Check the state rather than trusting this paragraph, which will age:
curl https://<your-relay>/ais/health # upstream, everReceived, messages, fallback
upstream: "silent" with everReceived: false means the provider accepted the subscription and
sent nothing — their outage. A rejected key looks different: the socket closes in about a second and
the reconnect count climbs by thousands a day rather than by four.
No free feed currently covers this water. Measured 2026-08-12: Fintraffic/Digitraffic is live, keyless and CC BY 4.0 but Finnish waters only (0 of 837 vessels inside the Kiel bounding box); Kystverket is Norwegian and its public endpoint fails its TLS handshake; AISHub requires contributing receiver hardware; the Danish archive is free historically but its live feed needs a bilateral agreement. A paid API, or an AOI on water that has an open feed, are the two real routes to permanently-live traffic.
Everything is built from openly licensed data, registered in NOTICE.md before use. The framing and content rules are binding and live in PLAN.md §1.0 and §3 — they outrank every other part of this repo. In particular: no customer, account or company name appears anywhere in this repository, including commit messages.
Getting started
You need Node 20+ and Python 3.11+.
npm install
pip install -r tools/requirements.txt

python tools/geodata/verify_sources.py         # are the sources still there?
python tools/geodata/pipeline.py               # every asset for the default site, in order
python tools/geodata/pipeline.py --aoi schlei  # and the second one
npm run dev
Tests: npm test for the unit suite (168), npm run test:e2e for the browser suite. The second
one exists for a class of defect the first structurally cannot catch — controls that are rendered
but cannot be reached, because the panel holding them grew past the bottom of the window. It
runs headed on purpose; headless Chromium software-rasterises WebGL and the same specs time out.
Access
The deployed app is gated behind Microsoft Entra ID. Nothing renders and no terrain is fetched
until an identity from the configured tenant has signed in through the Fabric broker — measured on
the deployed build: an anonymous visitor makes 2 requests and downloads no terrain. The gate
fails closed: any host other than localhost/127.0.0.1 requires sign-in, and a deployed build
whose Fabric configuration is missing refuses to render rather than opening itself to everyone.
localhost is exempt so a fresh clone still runs with npm run dev.
🔴 This gates the application, not the bytes. Fabric static hosting serves files without
authentication, so anyone holding a direct asset URL can still fetch it — verified, not assumed,
on this app and on the sibling app this pattern came from: GET /index.html returns 200 with no
credentials on both. Everything served is openly licensed geodata (DGM1, bDOM, Copernicus DEM,
Danish AIS), so what remains exposed is public terrain rather than customer material. If the
requirement is that the content itself is unreachable, static hosting is the wrong tier — that
needs a gateway which authenticates before serving, such as App Service or Container Apps with
Entra "Easy Auth", or Front Door in front of the origin.
pipeline.py runs the whole chain in dependency order and stops at the first failure. It streams
about 29 GB per site (6 GB of DGM1 tiles, 23 GB of bDOM) and keeps roughly 60 MB; pass
--skip-bdom to skip the surface top, in which case the app labels its coverage an explicit upper
bound rather than pretending otherwise. --only build_los_surface re-runs a single step.
A fresh clone has no terrain until the pipeline has run — the derived assets are tens of megabytes and are reproducible from open sources at any time, so they are not committed. That is a normal first-run state and the app must say so rather than failing with a fetch error.
Two sites, one world
The app ships two areas of interest, and the second one exists because of something the first
one cannot show. On the Kiel Fjord (Kieler Förde, AOI id kieler-foerde) a 25 m mast's geometric
horizon is about 21 km and the fjord runs out well before that, so the coverage disc tends to
swallow the map. The Schlei is a narrow brackish inlet 32 km up the coast: measured on Copernicus
DEM GLO-30, the longest unobstructed straight line from a sea cell has a median of 2.8 km against
the Kiel Fjord's 5.6 km.
| Kiel Fjord | Schlei | |
|---|---|---|
| Core | 193 km² | 202 km² |
| Open-water reach (median / p90) | 5.6 / 7.6 km | 2.8 / 4.8 km |
| Coastal relief p90 | 37 m | 27 m |
| Buildings | 54 323 | 15 209 |
| AIS positions on the same day | 44 084 | 77 617 |
What that buys, measured with the bDOM canopy in both blocking surfaces, one mast at each site's own best position:
| One mast, target 2 m | Kiel Fjord | Schlei |
|---|---|---|
| 5 m mast | 8.2 km² → 56 % of transits | 3.6 km² → 82 % |
| 25 m mast | 37.2 km² → 87 % | 16.1 km² → 87 % |
The same 87 % of traffic for 57 % less coverage area, and a 5 m mast on the Schlei already sees 82 % of the day. The scan does not reach as far, and on this water it does not need to.
⚠️ Note the relief row, because it corrects the obvious guess: the Schlei is flatter, not hillier. What shortens a sight line here is the water — the inlet is narrow and bends, so a sensor beside the channel sees a reach rather than a bay. The price is that placement stops being forgiving: a randomly placed 25 m mast sees a median of 2 % of transits here against 31 % on the Kiel Fjord, while the best position reaches 84 % on both. That makes the site optimiser the difference between a working system and an empty one.
Seven other coastlines were measured before this one was chosen, including the Norwegian fjords, which have seven times the coastal relief and no usable AIS archive — see PLAN.md §14.
Both cores sit inside one shared 181 × 156 km coarse shell, so the horizon tier is downloaded once
and the switcher swaps the analysis core without a page load. ?aoi=schlei deep-links to the
second site. Coverage, traffic and the optimiser stay scoped to one core — a percentage computed
across two inlets a ship cannot sail between would be arithmetic rather than a measurement.
Project structure
config/aoi/         area of interest as configuration — no coordinate is hard-coded in code
src/config/aoi.ts   the browser's half of the same promise: which sites ship, and the default
docs/               verification reports and decisions
tools/geodata/      open geodata in, browser assets out
data/               downloads, caches and derived data (gitignored — see NOTICE.md)
PLAN.md             the plan. §1.0 and §3 outrank everything else.
NOTICE.md           every source and its licence, registered before use
Scripts
| Command | What it does |
|---|---|
python tools/geodata/verify_sources.py |
probes every data source and reports what is actually there |
python tools/geodata/resolve_places.py |
resolves AOI coordinates from OpenStreetMap |
npm run dev |
development server |
Status
Deployed and rendering — live in the Rayfin Apps workspace, 53.2 MB, 6.2 M triangles, three
draw calls. Verified with Playwright against the deployed URL by reading pixels back out of the
framebuffer, not just by asserting on the DOM. See docs/deployment.md,
including the coastal-speckle defect the first deploy revealed and the measured 10.8 s first frame.
Phase 0 complete — sources verified, AOI resolved and written, licences registered. See docs/phase0-source-verification.md, including the two sources that answer "success" while returning nothing.
Phase 1 in progress — heightmap, land/sea mask, Copernicus shell and orthophoto drape all built, and the registration gate passes: the OSM coastline sits at the model's zero contour to a median of +0.37 m over 1727 vertices. See docs/phase1-terrain.md for what the build disproved about the plan's own payload assumptions.
Outstanding for Phase 1: the KTX2 drape, the sea surface, the shell as a browser asset, and the renderer — and with it the two gate items still open, measured VRAM and first-frame time.
Phase 2 complete — 54 323 LoD2 buildings built from the state 3D model and verified the only way that really settles it: 99.97 % of their vertices stand on land, checked against a land/sea mask that comes from a different pipeline entirely. Land cover and trees were deliberately not built, for reasons that are measured rather than assumed — see docs/phase2-buildings.md.
Phase 3 complete — a real day of shipping replayed over the terrain: 261 passages, 44 084 positions, 0.16 MB — 0.3 % of the payload, next to a terrain that costs 57 MB. Movement is the cheap part. The clock is a shader uniform rather than a per-frame buffer rebuild, so the whole day costs two draw calls. Story beats (busiest hour, quietest hour, first movement) are derived from the data at load time, not written into the app.
Ships are also the best test the terrain gets, because a vessel cannot drive across a field. That check found 7.27 % of positions on land — and rather than accept a tolerance, the reason was measured: those positions move at 5 knots, so "moored against a quay" was wrong, and they sit a median 4 m inland. The share was the wrong statistic; the gate now measures distance and passes at p90 = 27 m against a 120 m threshold. See docs/phase3-ais.md.
Identity is a build setting, chosen at ingest by fetch_ais.py --identity. The default is
full: MMSI, name, call sign, IMO, destination and draught, exactly as the vessel broadcasts them
and as the Danish Maritime Authority republishes them. commercial keeps identity for commercial
traffic and pseudonymises pleasure and sailing craft; anonymous is the original behaviour. The
asset records which mode built it, and the app reads the data rather than assuming.
Phase 4 complete — the visibility model, and the reason the rest of it was built. Drop a notional site anywhere, set a mast height and a target height, and the coverage field re-solves in 14–31 ms, so the shadow behind the headland moves while the slider moves.
It is geometry, not a radar model — line of sight against measured terrain under standard
refraction, with no cross-section, clutter, multipath or detection probability anywhere in it. That
is checkable rather than claimed: 14 tests run against the shipped solver and pin the visible
edge over open water to within 1 % of 4.12·(√h₁+√h₂), a formula the solver never refers to.
The more interesting output is what it admits. Vegetation used to be missing, and rather than
assert that this was fine it was measured on a tile that had both datasets — trees raise land by
metres, so the figure was an explicit upper bound. That caveat has now been retired the
expensive way: fetch_bdom.py streams 22.3 GB of the state's 20 cm image surface model, reduces
it 20 cm → 1 m → 4 m by block maximum, and the blocking surface takes the higher of terrain,
building and measured top. Bewuchs raises 4.9 M cells above building height, median +4.9 m, p90
+20.8 m. Over water the measured surface is deliberately discarded: image matching there returns
wave texture, and a phantom obstruction on the fjord would corrupt every published figure. The
AIS-based validation the plan wanted is refused, because the feed aggregates receivers whose
positions are unpublished and a correlation computed anyway would look rigorous and mean nothing.
A radial moiré in the first deploy also exposed a test that was tolerating a visible defect — 19 % of the field turned out to be silently unsampled. See docs/phase4-visibility.md.
Drone mode — a free camera with inertia, a stabilised gimbal and speed that scales with height above the surface, ported from the sibling alpine app and retuned around a 25 m mast rather than a 400 m alpine reference. Still no collision and no flight physics: it is a camera, not a simulator, and a test pins that decision so it cannot be "fixed" by accident.
What makes it more than sightseeing here is that it is wired to the coverage field: the HUD reports whether the camera itself is einsehbar or abgeschattet from the site. Fly out from the mast, cross the shoreline, and the readout flips — the coverage field becomes somewhere you can go and stand. See docs/drone-mode.md.
Phase 5 complete (relay tier) — a live traffic path whose gate was that live and replay reach the screen through the same render path, not two that resemble each other. Live vessels are written into the same buffer layout the replay asset decodes into and drawn by the same material instances, so they inherit the coverage uniforms for free. The proof is Mode D: toggling it while the scene runs on live data changes the rendered frame, which can only happen if both sources go through one shader.
The live source forbids browser connections, so a small zero-dependency relay is mandatory
rather than a design preference — and it is not part of the deployed static bundle, because
static hosting cannot hold a socket open and shipping the relay with the app would mean shipping a
key. It runs instead as a separate container the browser reaches over SSE, addressed by
VITE_AIS_RELAY; with that unset the app points at 127.0.0.1:8788 and simply stays on the
recording, which is a supported state rather than an error. Privacy is enforced where
the data enters: AIS_IDENTITY on the relay takes the same three values as the ingest script and
decides how much of MMSI, name, call sign, IMO and destination leaves the process. anonymous is
still pinned by tests — including a standing runtime assertion that refuses to send a frame
carrying an identifier in that mode. A --replay mode proves the whole chain with no key and no network, and the app says
so in orange rather than passing recorded data off as live.
Deployment found three things local testing did not: a Private Network Access block on
https → loopback, a shared-geometry bug where setDrawRange counted indices instead of vertices,
and a dead end where asking for live with no relay hid the replay controls while the recording kept
playing. See docs/phase5-live.md.
Live ship list — the feed is now selectable, not just visible. One row per vessel in the modelled water, sorted with the moving ships on top; clicking a row moves the camera to it, and each row links out to an independent AIS map so the position can be checked against a second source.
🔴 The link addresses the ship when the feed can name it, and the place when it cannot. Public AIS services address a vessel by MMSI, so keeping the MMSI is what makes an independent check of this ship possible at all — the app used to be unable to offer that, and the reason was never technical. A vessel that has not yet sent a static report still falls back to a positional link, because AIS transmits identity every few minutes against a position every few seconds.
Two defects showed up only against the running relay. The client's vessel map never forgets, which is right for drawing trails and wrong for a list claiming to be live — measured, it held 33 vessels while the relay reported 6 present, so entries now expire five minutes after their last report, re-checked on a timer rather than only when a frame arrives. And the relay subscribes to the far wider shell bbox: ~380 vessels in the feed against ~65 in the modelled water, so the list is scoped to the terrain bounds and the remainder is counted and named rather than silently dropped. Every row states how old its position is, because at 15 kn a two-minute-old report is already a kilometre out. See PLAN.md §14.11.
Assistant (chat) — a panel that answers questions about the area, the recorded day, individual
vessels and the coverage currently on screen. Backed by Azure OpenAI through a small container
(server/assistant/), reachable only through the app's own key gate.
🔴 It answers from tools, never from recall. Every figure comes from the shipped asset the
browser downloads, and coverage numbers come from the app's own reportData() — the same model
the exported annex renders from — because the viewshed is solved in the browser against the user's
placed sites. Verified live: asked what a placed site covers, it answered "81 %, 111 of 137
transits", and the scene's own report returned exactly {137, 111, 0.810}.
⚠️ The guardrails are restated in the system prompt, because a model is the one place they cannot be enforced in code. Asked for a radar detection range it refuses and explains that the model answers geometric line of sight only; asked to name warships it declines; asked for coverage with no site placed it says the figure is unavailable instead of estimating one. Nine unit tests assert each rule survives in the instructions, and two end-to-end tests check the behaviour against the running backend. See server/assistant/README.md.
Chat only — no voice, by request.
traffic. The gate was that the model and the app agree on every headline figure, and it is a script rather than an assertion: each figure is computed twice — once in Python from the shipped asset the browser downloads, once in DAX over OneLake — and the check exits non-zero on any drift. All nine headline figures, all 24 hourly values and all 13 vessel classes agree.
The definition that would have broken it is worth naming: "vessels under way in an hour" is an interval overlap, not a group-by on positions. The obvious implementation is easy, plausible and wrong, which is exactly why two implementations get checked against each other.
The model counts passages, not distinct vessels — a passage is the unit the visibility question is asked about, and the 20-minute gap rule splits one moored hull into several. (It was originally also a necessity, because identity had been dropped at ingest; that is now a build setting, but the grain stayed because it is the right one.) Six failure modes are recorded in docs/phase6-semantic-model.md, including two that produce no error at all: a Direct Lake model that must be framed before it can be queried, and an IBCS chart whose category cap silently drew ten hours of a twenty-four-hour day — omitting its own peak.
Fabric architecture
npx rayfin up provisions:
- Entra sign-in (Fabric identity)
- Static web app
Data
Sources and their licences are listed in NOTICE.md.
Credits
Third-party data and licences: NOTICE.md. Licence: LICENSE. Copyright (c) Microsoft Corporation..