A reconstruction of the Ahr valley flood of 14–15 July 2021, as an interactive 3D data twin.
⚠️ Demonstration and training purposes only. Not a real risk assessment and not a basis for insurance or financing decisions.
What it does
On the night of 14 to 15 July 2021, 136 people died in Rhineland-Palatinate, most of them along the Ahr. This application reconstructs what happened entirely from publicly available data, to answer three questions: what was known, what was missing, and what would be possible today?
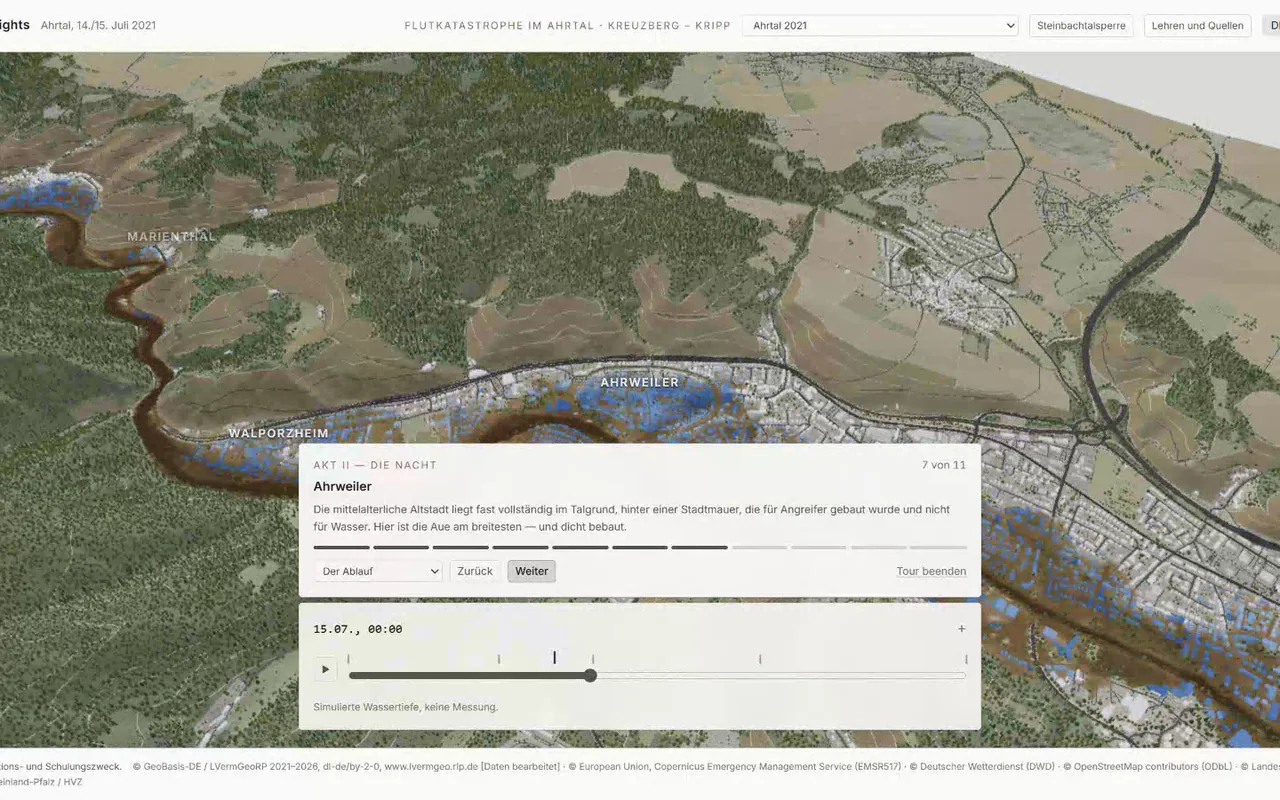
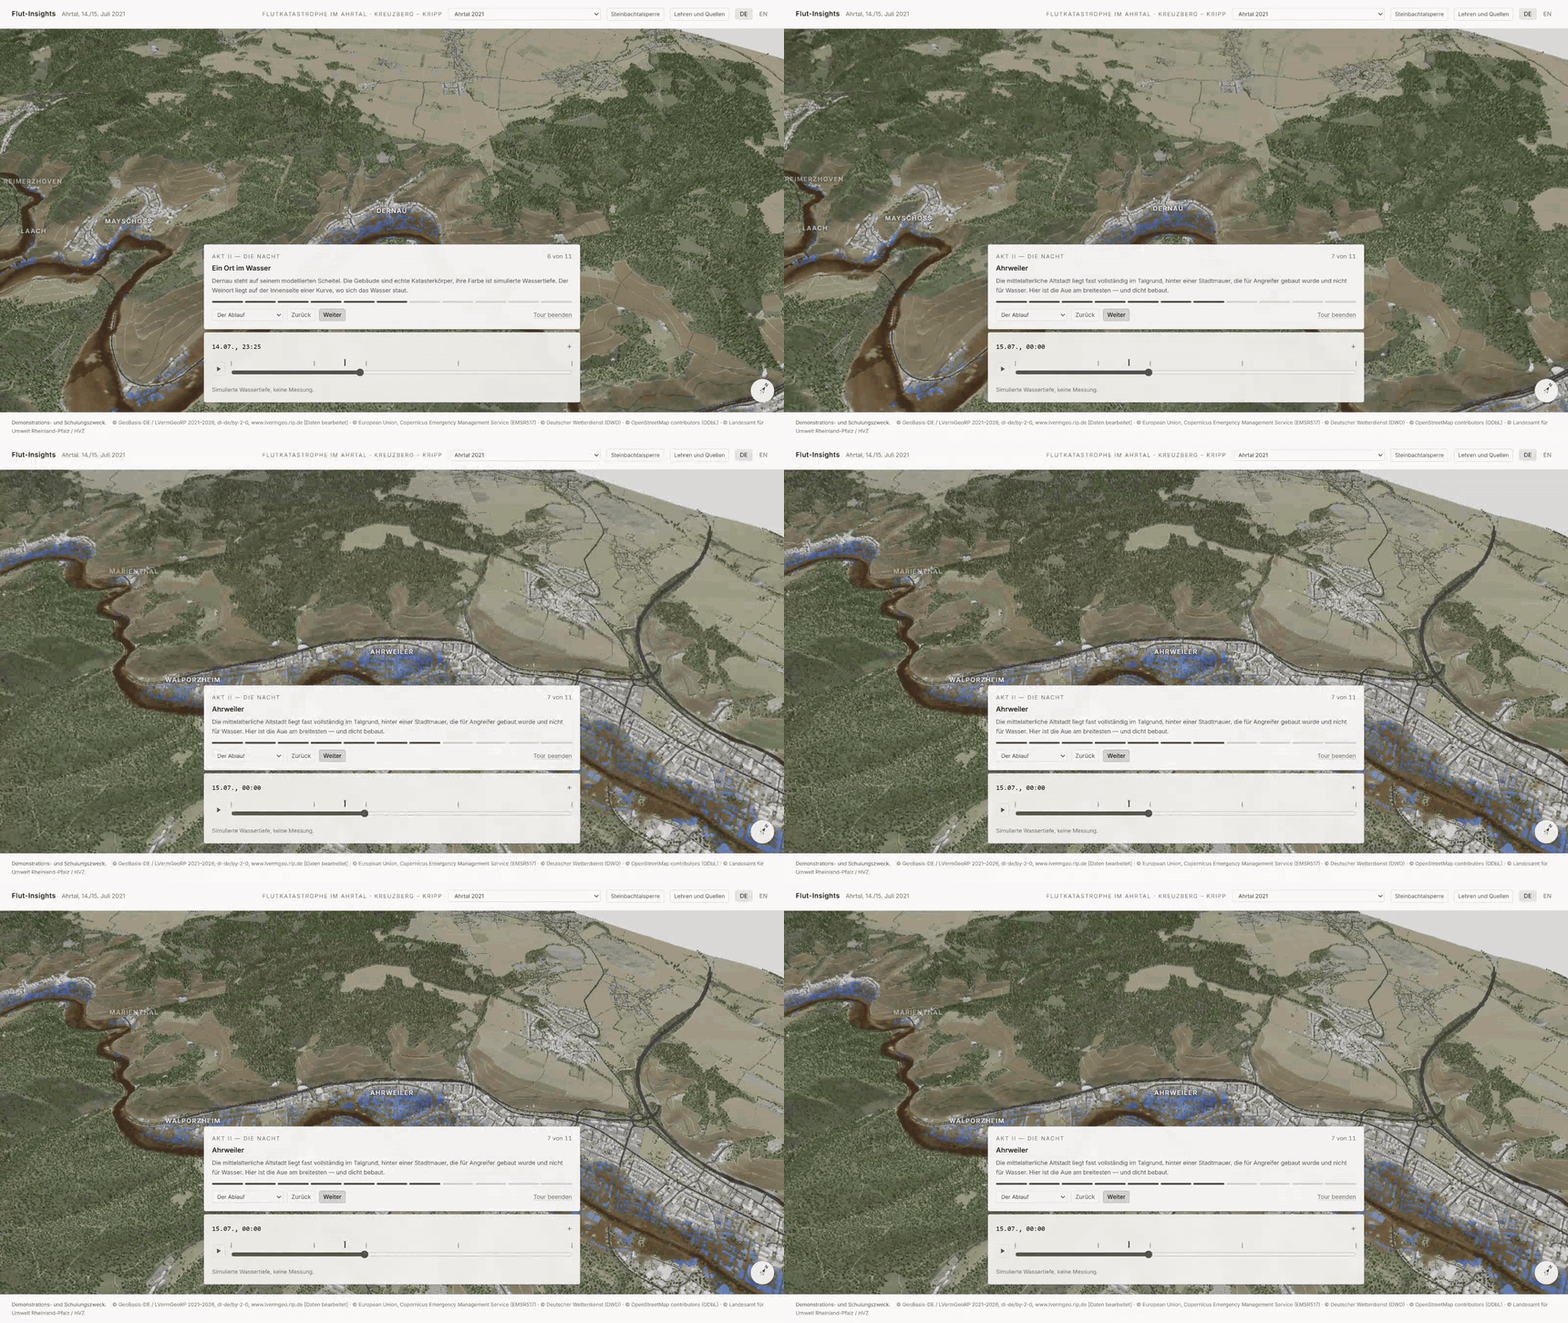
Flood Insights is a Microsoft Fabric App. It renders 24.6 km of the Ahr valley in 3D from official 1 m terrain and LoD2 building data, replays the flood along a scrubbable timeline driven by a stage-discharge rating built from real cross-sections, and closes by letting the user ask what would have helped? — more warning time, wider natural-hazard insurance cover, flood-adapted rebuilding — and watch the numbers move.
The reconstruction is checked, not asserted. The simulated extent is scored against the Copernicus EMSR517 flood trace at 4 m resolution and reports IoU 0.508 — good enough to reason about, not good enough to pretend it is truth. That number is shown inside the app, next to the map, including when it is unflattering.
It is not a disaster experience and not a sales prop. The framing, content and tone rules are binding and are written down alongside the project plan. They outrank every other part of this repository.
Getting started
You need Node 20+, Python 3.11+ and about 250 MB of download budget for the geodata.
npm install
pip install -r tools/requirements.txt

npm run data:build     # downloads and derives terrain, buildings and flood extent
npm run dev            # http://localhost:5173
data:build is the step people skip. Without it the app still starts, shows the remembrance screen, and then
tells you exactly which command you are missing instead of failing with a blank canvas — but there is no twin
to look at until it has run. It is safe to re-run and skips anything already downloaded.
Deploy to Fabric with Rayfin:
npx rayfin up --tenant <tenant-guid> --workspace "Rayfin Apps" --dry-run   # preview first
npx rayfin up --tenant <tenant-guid> --workspace "Rayfin Apps"
Then smoke-test the deployment itself:
FLUT_DEPLOYED_URL=https://<host>.webapp.fabricapps.net npx playwright test deployed
Project structure
config/aoi/     area-of-interest definitions — the app is parameterised, not hard-coded
docs/           research notes, source documents, licence evidence
tools/geodata/  ingestion and preprocessing (DGM1, LoD2, EMSR517, OSM, gauges) + pipeline.py
tools/fabric/   lakehouse, semantic model and Real-Time Intelligence setup
src/            React + Three.js front end
  data/         the fact register — every figure with its source
  twin3d/       terrain, water, buildings, hydrograph, what-if engine
  components/   remembrance screen, shell, validation and Act IV panels
  i18n/         de.json / en.json — all user-facing strings
public/terrain/ generated heightmap, flow field and building mesh (built, not committed)
rayfin/         Fabric App deployment config (.env and .deployments.json are gitignored)
e2e/            Playwright specs, including the guardrail tests
Scripts
| Script | What it does |
|---|---|
npm run dev |
Vite dev server on port 5173 |
npm run build |
Type-check and build to dist/ |
npm run lint |
ESLint across the project |
npm test |
Vitest unit tests — the what-if engine and the fact register |
npm run test:e2e |
Playwright, 27 specs including the §2 guardrail rules |
npm run data:build |
The full geodata pipeline; --list, --only and --skip are supported |
npm run gauges:fetch |
Live Ahr gauge readings from the LfU Rheinland-Pfalz open API |
npm run fabric:setup |
Create the lakehouse, load the tables, build the semantic model |
Three conventions worth knowing before you change anything
The area of interest is configuration, not code. No coordinate, village name or gauge id belongs in a source file. It all lives in config/aoi/ahrtal-2021.json. Ahrtal 2021 is the first instance of this app, not the app itself.
An unsourced figure must look broken. Every number shown to a user is declared in
src/data/facts.ts with its source. A fact with source: null renders through
SourcedFigure as a loud defect marker, not as a clean number. That is deliberate: PLAN §4.8 says an
unsourced claim does not ship, and a visible defect enforces that far better than a comment does. The death
toll was such a fact until the final report of the Landtag's committee of inquiry was cited, and correcting it
changed the number and the area it describes: the app claimed 134 deaths in the Landkreis Ahrweiler, while
the inquiry states 136 for Rheinland-Pfalz and gives no district figure at all. isReleaseReady() now returns
true, and a unit test pins both the value and its issuer so the scope cannot drift back.
Observed damage is quoted, never inferred. Real buildings carry damage grades only where Copernicus EMSR517 graded them — attributed to Copernicus, matched by point-in-footprint containment rather than proximity, never merged with modelled output, and never shown next to a monetary figure. The rules and the reasoning are in PLAN §2.2. An earlier nearest-neighbour join was thrown away when it turned out the median distance to a graded point was 255 m: close enough to label the wrong house.
Data
Every layer in this app is public data under an open licence. That is not a convenience — it is the point: the data existed in 2021, it just was not connected.
Full source list, licences and the mandatory attribution strings are in NOTICE.md. The attribution is not decorative; it must travel with any redistribution or public deployment.
Related
- Base app:
digital-twin-fabric-app(wind-farm 3D twin — SceneEngine, Foundry voice/chat, tour, Rayfin deploy) - Data pipeline patterns:
DWD-Wetter-Insights
Fabric architecture
npx rayfin up provisions:
- Entra sign-in (Fabric identity)
- Static web app
Credits
Third-party data and licences: NOTICE.md. Licence: LICENSE. Copyright (c) Microsoft Corporation..