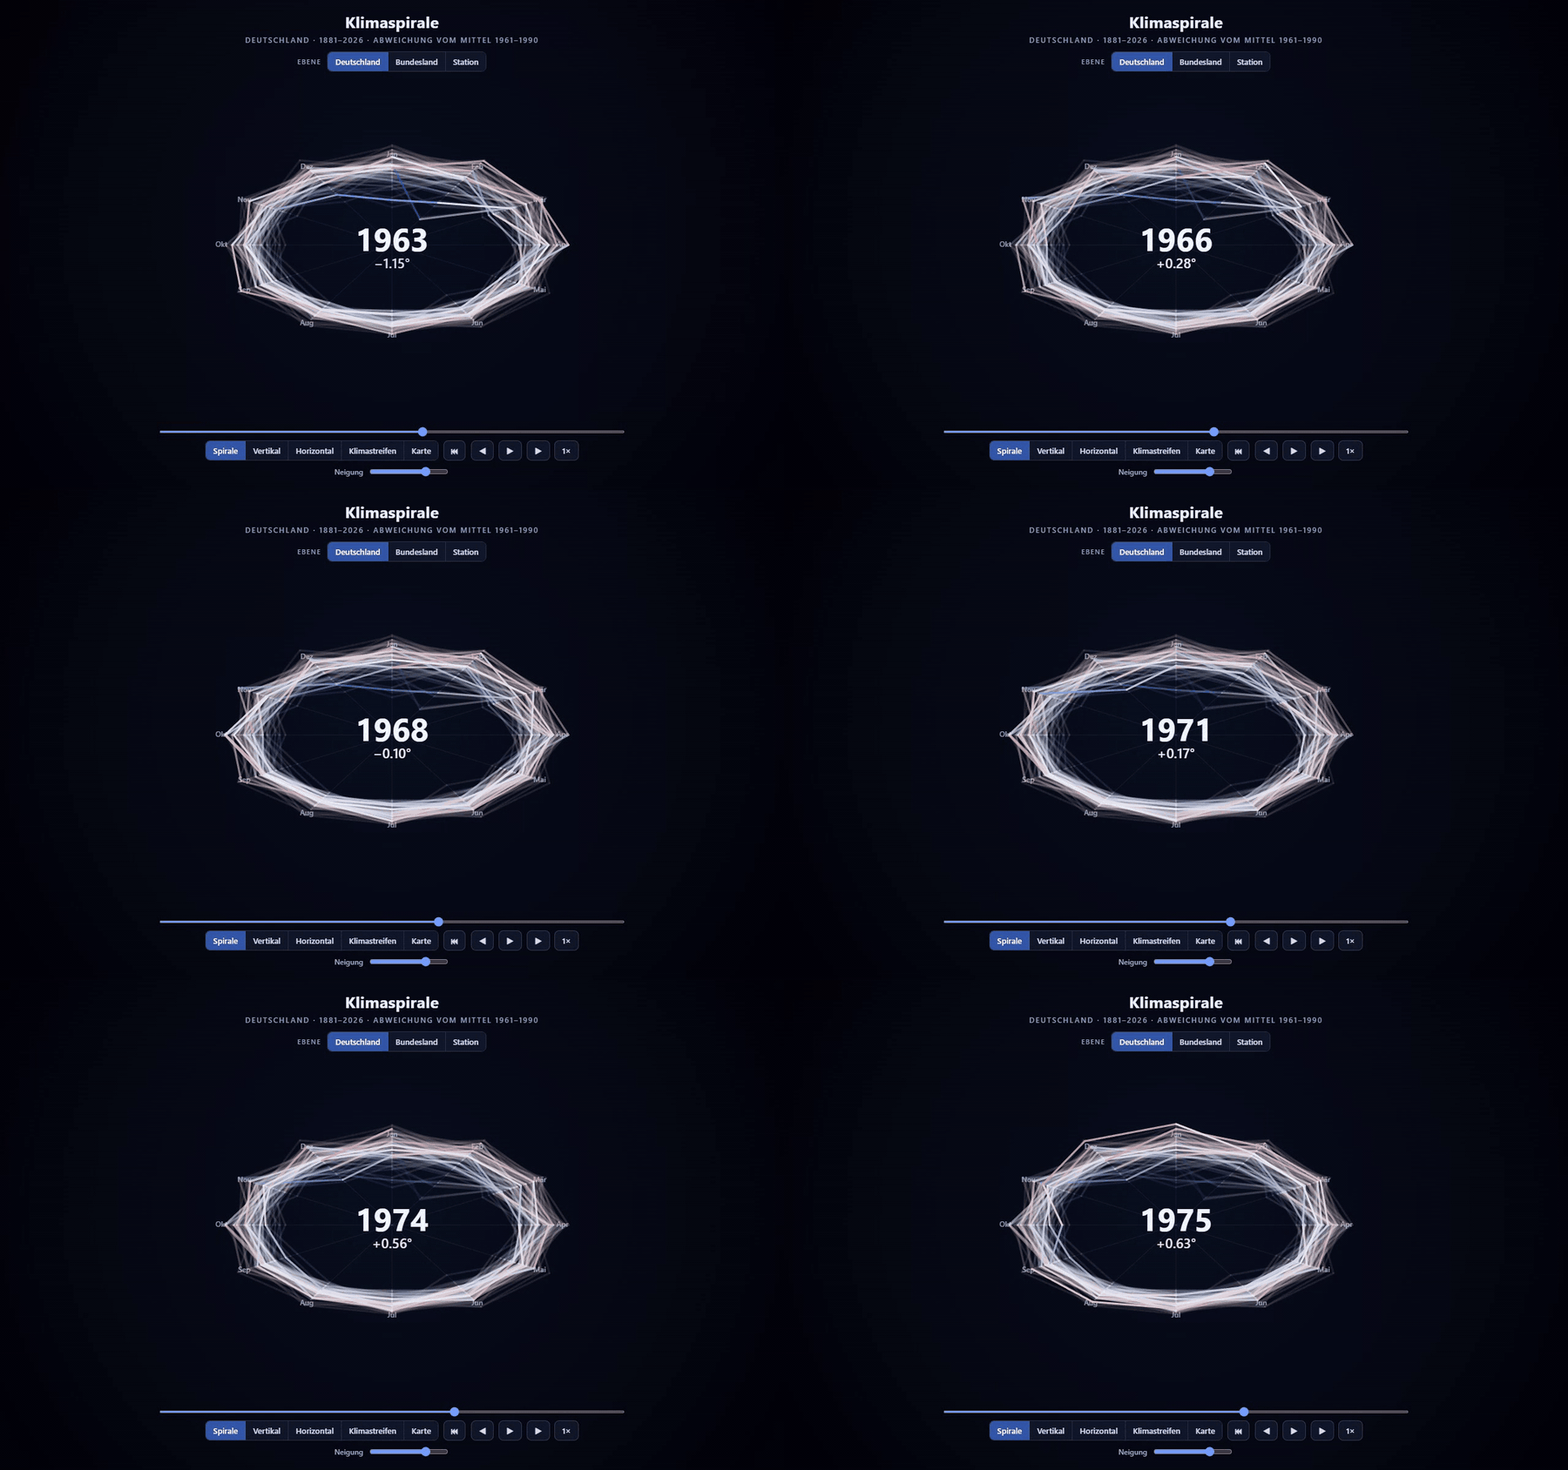
An interactive climate viewer for German weather data, rendered entirely in the browser with Canvas 2D + TypeScript — no Power BI custom visual and no WebGL dependency, so it drops straight into a Fabric App (or any web page / iframe). Five views share one playback timeline:
- Spirale — a tilted climate spiral (yearly mean-temperature anomaly, blue → red), whose radius scales continuously by temperature;
- Vertikal — the years stacked into a NASA-style funnel / tornado;
- Horizontal — anomaly time-series bars from the 0° baseline;
- Klimastreifen — Ed Hawkins' warming stripes;
- Karte — an interpolated (IDW) weather-anomaly heat map of Germany with a year slider, clipped to the Bundesländer outline, switchable across Temperatur / Niederschlag / Sonnenschein / Wind (anomaly vs 1961–1990).
The first four views also offer a region picker (Deutschland / Bundesland /
single station); the Karte view interpolates all stations at once. All anomalies
and scaling are computed in the browser from the committed data/*.json.

What it does
- A tilted climate spiral of yearly temperature anomaly
- The same series as a stacked funnel, as anomaly bars, and as warming stripes
- An interpolated heat map of Germany clipped to the federal-state outline
- Five views sharing one playback timeline, in Canvas 2D - no WebGL, no custom visual
Run it
No build is required to view it — the compiled JS in dist/ and the sample
data in data/ are committed. Serve the folder over HTTP and open it:
cd webapp/klimaspirale
npm run serve            # python3 -m http.server 8080
# then open http://localhost:8080/
Opening index.html directly from disk also works: the app falls back to a
built-in generated sample dataset when it cannot fetch the JSON.
Build (TypeScript)
cd webapp/klimaspirale
npm install              # installs the TypeScript dev dependency
npm run build            # tsc -> dist/
npm run data             # regenerate data/klimaspirale.json from the sample generator
Sources live in src/:
| File | Responsibility |
|---|---|
src/types.ts |
Data + geometry types (dataset, stations, weather map, Germany outline) |
src/data.ts |
Dataset loaders (loadMultiDataset, loadStations, loadWeatherMap, loadGermany), 30-day rolling average, sample generator |
src/engine.ts |
All interactive rendering: the five views, region/parameter pickers, controls, IDW map interpolation |
src/main.ts |
Bootstrap — reads #app data-attributes and starts the viewer |
(src/spiral.ts is the original SVG spiral implementation, kept for reference.)
Configuration
The #app element accepts data-* attributes:
| Attribute | Default | Effect |
|---|---|---|
data-src |
./data/klimaspirale.json |
National + Bundesländer monthly dataset |
data-stations |
./data/stations.json |
Per-station monthly series (region picker) |
data-weather |
./data/weather_map.json |
Per-station annual multi-parameter data (Karte) |
data-germany |
./data/germany.json |
Simplified federal-state outline (map clip + borders) |
Real data
data/klimaspirale.json ships with a deterministic sample dataset. To use
real DWD observations, export the daily mean temperature
(temperature_air_mean_2m) — averaged across stations per day — into this
shape:
{
  "region": "Deutschland",
  "parameter": "temperature_air_mean_2m",
  "years": [
    { "year": 2014, "days": [ { "date": "2014-01-01", "tMean": 4.2 }, ... ] }
  ]
}
There are two ready-made exporters, both producing exactly this shape:
In Fabric (recommended). Run the “Export Klimaspirale dataset” cell at the end of
DWD-Wetter-Insights Finalize.ipynb. It aggregatesWetter.BeobachtungenTagwith Spark, writesklimaspirale.jsonto the Lakehouse Files area, and supports scoping to a singleBUNDESLAND. Download the file and commit it todata/.Offline / CLI.
tools/export_data.pyconverts a long-format CSV/TSV of daily observations (columnsDatum, Parameter, Wert, optionalStation_Id) into the same JSON — Python standard library only:python tools/export_data.py --input observations.csv \ --output data/klimaspirale.json --region "Deutschland"
The 30-day rolling average and all scaling are computed in the browser, so no pre-aggregation beyond daily means is needed.
See docs/REFERENCES.md for the climate-spiral
prior art this builds on.
Fabric architecture
npx rayfin up provisions:
- Entra sign-in (Fabric identity)
- Static web app
Getting started
npm install
npm run serve
npx rayfin up --workspace-id <your-workspace-guid> --tenant <your-tenant-guid>
Any workspace or item id this app needs is read from the environment, with no default.
Project structure
data/           input data (see the Data section)
rayfin/         deployment config - redirect URIs are loopback only
src/            the application
tools/          data pipeline and build helpers
Scripts
| Script | What it does |
|---|---|
npm run build |
production build |
npm run build:fabric |
build the bundle Fabric static hosting serves |
npm run data |
|
npm run export |
|
npm run rayfin:up |
deploy to your Fabric workspace |
npm run serve |
serve locally |
npm run watch |
Credits
Part of Fabric-Apps, MIT licensed.
Data
Deutscher Wetterdienst open climate data.