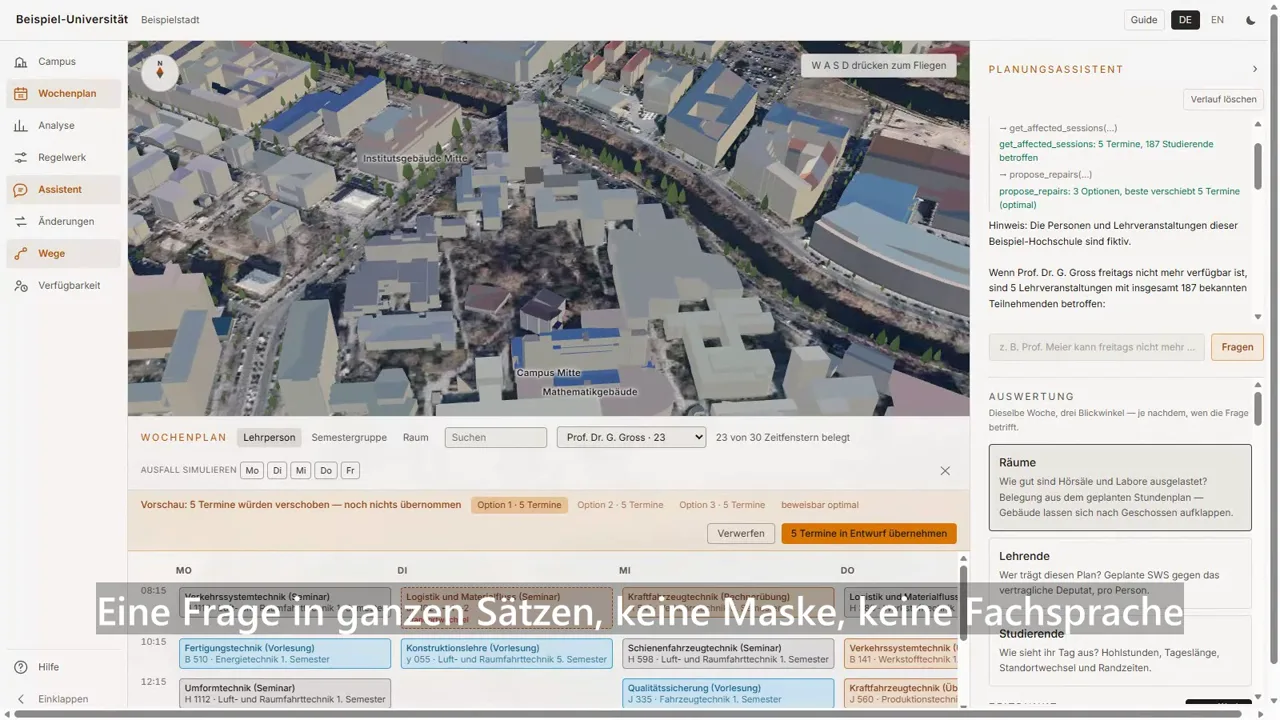
A timetable that repairs itself, on a twin of the real campus.

A campus in Regensburg, Bavaria. 1 m state terrain under a 20 cm orthophoto, LoD2 buildings with roof colour measured from the aerial photograph, and the city's own tree cadastre — no map service, no tile server, no API key.
Read this first: where the data comes from
Everything in this template is open, public data or is generated by this repository. There is no customer data in it, and there is no private data in it.
| What you see | Where it comes from |
|---|---|
| Terrain, orthophoto, buildings, trees | Official state survey open data — LDBV Bavaria (CC BY 4.0), LGL Baden-Württemberg (dl-de/by-2-0), Geobasis NRW (dl-de/zero-2-0), Copernicus DEM |
| Land cover, footpaths, indoor room outlines | OpenStreetMap, ODbL |
| Room numbers and floor plans | The universities' own published site and floor plans |
| The timetable | Generated by this repository — see tools/data/generate_timetable.py |
| Seats, attendance, building condition, costs | Invented, and badged as synthetic wherever they appear |
Every source and its required attribution is in NOTICE.md. Nothing here needs a map service, a tile server or an API key, at build time or at run time.
No university supplied anything, reviewed anything or endorsed anything. The buildings and the room numbers are real because they are published; the teaching week inside them is ours. That combination is the one genuinely risky thing this app does — a real, checkable room number next to an invented utilisation figure reads as the university's own number — so provenance is part of the data model rather than a disclaimer, and the app refuses to make claims it cannot support. See What is real and what is not.
Read this second: why these eight universities
The selection is close to arbitrary, and it is not a ranking, a recommendation or a customer list. They are simply places where the two things this app needs both exist:
- the state publishes LoD2 buildings, a 1 m terrain model and a 20 cm orthophoto as open data, and
- there is a campus worth flying a camera around.
Beyond that the choice was "several of the larger German universities, across four different state survey authorities" — because a twin that works in exactly one state is not a template, it is a one-off. Aachen, Cologne and Münster are in this list mainly to prove the North Rhine-Westphalia adapter works, and Tübingen is here because Baden-Württemberg publishes its data through an entirely different portal from Bavaria's.
Swap any of them out. A site is one JSON file in config/aoi/ and one pipeline run.
Demonstration and training only. Not a planning system of record, and not a statement about any real institution's rooms, staff, utilisation or building condition.
What this is
A Microsoft Fabric App for the person who has to move a lecture.
A professor says they cannot teach on Friday. Four courses have to move; each one needs a free room of the right kind, a slot where the students are not already somewhere else, and — because this university has two campuses 2.5 km apart — enough time to get across town in the break. Doing that by hand in a spreadsheet is a day's work, and the plan that comes out is not obviously any good.
Here it is a sentence typed into a chat. An OR-Tools CP-SAT solver returns the smallest set of moves that resolves it, with a proof of optimality, and the calendar shows what would change before anything is saved.

One lecturer's Friday is blocked. Four sessions have to move; the solver returns three options, each of four moves, each provably optimal — and nothing is applied until somebody says so. The struck-through entries are what would leave; the plan of record has not changed.
There is a narrated film of this, recorded against the deployed app rather than a dev server:
media/campus-insights-demo.mp4, with an eight-second opener joined on the front. It is not in the
repository — rendered video is reproducible output, so media/*.mp4 is gitignored — and
The films are rebuilt from the app itself; the recording tooling is not part of the public tree.
⚠️ The opener is generated imagery and not the twin — see What is real and what is not. Everything after the cut is the app.
The subject is timetabling. The point is Fabric — the app itself as the delivery vehicle, a Fabric SQL database behind the write-back, and an Azure AI Foundry agent that calls the solver as a tool rather than pretending to be one. A language model never places a session. It decides what the planner meant; only the solver decides whether a plan is legal.
The campus is not a picture of a campus
The 3D view is built from official state survey data and nothing else — no map service, no tile server, no API key, at build time or at run time.
- 1 m terrain from the state survey, resampled to a 2 m grid, at true scale with no vertical exaggeration
- a 20 cm orthophoto draped over it
- LoD2 buildings with measured roof colour — the median of the aerial-photo pixels inside each building's own roof outline, 98–99 % coverage
- individual trees from the state tree cadastre, or detected from a normalised surface model where no cadastre exists
- a Copernicus DEM shell out to ~20 km, so the horizon is a landscape rather than a cliff edge
That is what makes the travel-time constraint honest rather than decorative: the distance the solver refuses to schedule across is the distance you can see.
Buildings open. Click one and it explodes into its floors, drawn from published architectural floor plans where the university has them and from surveyed OpenStreetMap indoor mapping where it does not — real rooms, with their real numbers, coloured by how much of the week they are used.

Building K, opened. The ground and first floors are traced from the university's published storey plans — 67 rooms straight off the CAD drawing — and the rest are generated inside the real building outline. The panel says which is which, because the room numbers are real and the utilisation is not.
Eight universities, one build
The site is configuration. Adding one is a JSON file and a pipeline run, and the eight below were chosen for the reasons in Read this second rather than for anything about the universities themselves.
| AOI | University | Planner | Survey |
|---|---|---|---|
oth-regensburg |
OTH Regensburg — two campuses, 2.5 km apart | yes | LDBV Bavaria |
lmu-muenchen |
LMU Munich — main campus + Innenstadt teaching hospital | yes | LDBV Bavaria |
garching |
TU Munich, Garching research campus | — | LDBV Bavaria |
tuebingen |
University of Tübingen — Old Town, Neckar, castle | — | LGL Baden-Württemberg |
fau-erlangen |
FAU Erlangen-Nürnberg | — | LDBV Bavaria |
aachen |
RWTH Aachen University | — | Geobasis NRW |
koeln |
University of Cologne | — | Geobasis NRW |
muenster |
University of Münster | — | Geobasis NRW |
Open one with ?aoi=<id>, or from the map of Germany on the landing screen. The six sites without
a planner are campus twins: they have a scene and no week to replan, and the app says so rather
than offering a calendar that would open onto nothing.

Tübingen — 6 417 LoD2 buildings and 11 406 trees over 127 m of real relief, from a different state survey (LGL Baden-Württemberg) reached through an entirely different portal. Same pipeline, same code, one JSON file. That is the difference between a template and a one-off.
Getting started
npm install
npm run data:build -- --aoi oth-regensburg    # ~10 min, downloads ≈1 GB of survey tiles
npx vite                                       # http://localhost:5173
⚠️ npx vite, not npm run dev. The npm scripts have Rayfin pre-hooks that need Fabric auth;
npx vite and npx vite build run without it.
⚠️ public/terrain/ is not in the repository. It is 20–40 MB of generated terrain, drape,
building and vegetation assets per site, rebuilt by the pipeline from the open sources listed in
NOTICE.md. Until it is built, the app renders a setup notice explaining what to run —
not a blank canvas.
The geodata pipeline needs Python 3.11+ and exactly three third-party packages:
pip install -r tools/requirements.txt          # numpy, pillow, scipy
python tools/geodata/pipeline.py --aoi oth-regensburg --list   # what runs, and what is skipped
The planner backend (FastAPI + CP-SAT + the Foundry agent loop) is a separate container:
pip install -r server/requirements.txt
python tools/data/generate_timetable.py --site oth
python tools/data/validate_dataset.py --site oth     # an independent gate; exits non-zero
SCHEDULER_SITE=oth uvicorn app:app --app-dir server --port 8080
The app runs without it. With no backend configured the twin, the lenses and the deep links all work, and the planner surfaces are simply not offered.
Deploy to Fabric with npx rayfin up, then verify the running system —
node tools/verify_deploy.mjs --url <hosting URL> — because the frontend and the backend deploy
separately and diverge silently.
Project structure
| Path | What lives there |
|---|---|
src/twin3d/ |
The 3D engine: terrain, drape, LoD2 buildings, vegetation, rooms, walk routes, the flying camera. Three.js, no scene-graph framework |
src/lenses/ |
Room occupancy, teaching load, plan quality, building condition — a registry, so a site only offers a lens whose data it has |
src/planner/ |
Calendar model, conflict shapes, walk-route transfer logic |
src/components/ |
The cockpit: nav rail, week grid, chat, change list, guided tour |
src/config/ |
AOI registry, the public-release switch, deep-link parsing |
src/i18n/ |
German and English catalogues. Parity is a contract, and it is tested |
server/ |
FastAPI backend: the CP-SAT solver, the agent tools, the Foundry loop |
tools/geodata/ |
The 13-step pipeline that turns survey downloads into browser assets |
tools/data/ |
Timetable generation, room geometry, walking routes, the dataset validator |
tools/tests/ |
Python suites. ⚠️ scripts, not pytest — run each file directly |
config/aoi/ |
One JSON per site: bounding boxes, control points, lenses, attribution |
config/academic/ |
The invented half of a university: programmes, block scheme, room policy |
rayfin/ |
Fabric service configuration and the write-back data schema |
e2e/ |
Playwright. Asserts pixels and scene state, not that a button has a class |
Scripts
| Script | What it does |
|---|---|
npm run dev |
Vite dev server (Rayfin pre-hook; use npx vite to skip it) |
npm run build |
tsc -b then vite build |
npm run preview |
Serve the built bundle |
npm run lint |
ESLint 9 flat config |
npm test |
Vitest unit suite |
npm run e2e |
Playwright, fast project |
npm run e2e:full |
Playwright, everything. ⚠️ workers: 1 is deliberate — two large WebGL scenes at once make the suite lie |
npm run data:build |
The geodata pipeline for one AOI |
npm run data:probe |
Survey a candidate site before committing an AOI to it |
npm run check:release |
Is the publication switch set correctly, and does the disk agree? |
npm run check:publishable |
Read every file git would carry, as bytes, and refuse anything unreviewed |
npm run test:release-switch |
Run the unit suite in all six release postures |
What is real and what is not
This app draws real buildings, at true scale, with their real room numbers on them, so every figure it shows is read as the university's own. Provenance is therefore part of the data model rather than a disclaimer:
| Measured | Derived | Invented (badged as synthetic) |
|---|---|---|
| terrain, orthophoto, buildings, trees | room area, from real polygons | seats per room, attendance |
| room polygons, usage types, floor assignment | storey count, gross floor area | the teaching week itself |
| campus footprints, walking-path network | travel times, from the real path graph | building condition grades, refurbishment cost |
A room with no calendar is grey, never 0 % — "unknown" and "empty" are different answers, and the whole product depends on the difference staying visible.
⚠️ One file in this repository is generated imagery, and it is not the twin.
media/campus-intro.mp4 is an eight-second cinematic opener made with Sora 2 — a photoreal aerial
over a German university campus that does not exist. It is a mood opener for the front of a demo
reel and nothing else. Every claim the table above makes is about the app; this clip is not the
app, must never be shown as what the app renders, and would undermine exactly the property this
section exists to protect if it were. The recorded demos beside it
(campus-insights-*.mp4, campus-scheduler-lmu-guide.mp4) are screen captures of the real thing.
See NOTICE.md for sources and licences, and AGENTS.md before changing anything that produces a number.
What it does
Campus Twin turns a university's timetable into something you can see. Every teaching session is placed in a real room in a photoreal 3D model of the campus, built from official state survey data, so an over-full lecture hall and a building nobody is using are visible rather than inferred from a table. A planner can move a session and watch the consequences land: room utilisation, walking distance between consecutive sessions, and staffing load.
Eleven sites are configured. One of them, campus-demo, is an invented university used for
demonstrations, and it is the only one whose film ships with this repository.
Fabric architecture
- Rayfin app with Fabric authentication, so a planner signs in once and the app queries as that user.
- Fabric SQL database for the plan itself: proposals, confirmations and per-lecturer availability. The tables hold statements somebody made, never a cross join of defaults.
- Semantic model and report over the same data, generated by
tools/fabric/, so the numbers in the app and the numbers in Power BI cannot drift apart. - Static hosting for the client, with terrain served separately because eleven sites of survey data do not fit inside a 100 MB package.
Data sources
| What | Where it comes from | Licence |
|---|---|---|
| Terrain, orthophoto, buildings, trees | Official state survey open data (LDBV Bavaria, LGL Baden-Wuerttemberg, Geobasis NRW) | CC BY 4.0, per-state attribution in NOTICE.md |
| Building footprints and room polygons | OpenStreetMap | ODbL |
| Elevation | Copernicus WorldDEM-30 | per its own terms |
| Timetables | Generated from each site's academic profile by tools/data/generate_timetable.py |
ours |
⚠️ No university's own timetable export is included. config/release.json is a switch,
read by both the app and the Python pipeline, that decides what a build may carry. In this
tree it stands at realCustomerData: exclude and navigatumData: synthetic, which means
every timetable here is invented and reproducible from configuration. npm run check:release and python tools/verify_publishable.py both fail if that stops being true.
Credits
Terrain, imagery and building data are published by the German state survey authorities and
by OpenStreetMap contributors; the exact attribution strings they require are reproduced
verbatim in NOTICE.md and must not be reworded. Copernicus WorldDEM-30 is used under its
own terms. Everything else here is mine, and it is a personal project, not a Microsoft
product, and not affiliated with or endorsed by Microsoft.